Data Visualization is a powerful tool that helps make sense of your complex data, transforming it into insights and stories using the power of charts & graphs. If you are wondering how to create magic with data and make it easy to study with the visualization tools, then this blog post is for you! With our staff augmentation service, we provide the best Data Visualization resources to help you take your business to the next level! Let us show you how.
Making Sense Of Data Is Critical For Decision Making
Making the right decisions for your company is crucial. To do that, one needs to conduct research and analysis and have access to data. However, just having data isn’t enough – you need to be able to structure it in a way that allows you to clearly answer the questions which will help guide you towards the right decision-making. Also, the structure comes only when you have experienced resources who understand the data and can take the valuable steps to chalk out an actionable plan with it.
Data Visualization Consulting Helps You Understand Data
Visualization tools are no longer simply trending—they’re quickly replacing traditional text-based reports. This has opened up a whole new world of possibilities, allowing businesses to explore data more effectively and efficiently. Visualizations are a great way to quickly capture and make sense of complex data. Our data visualization services can help you identify trends, track progress & performance, and detect any abnormalities in the data. This is an amazing advancement in technology – our brains are wired to analyze visuals faster than text, making it easier to understand vast amounts of data!
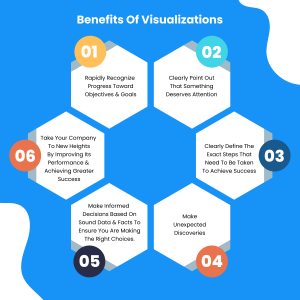
Benefits Of Visualizations
Implementing data visualization correctly will result in a range of amazing capabilities, such as:
- Rapidly recognize progress toward objectives and goals
- Clearly point out that something deserves attention
- Clearly define the exact steps that need to be taken to achieve success
- Make unexpected discoveries
- Make informed decisions based on sound data and facts to ensure you are making the right choices.
- Take your company to new heights by improving its performance and achieving greater success.
Blast Enables Exceptional Visualizations & Delivers Groundbreaking Expertise!
Our highly experienced analytics consultants can help you transform your data into meaningful insights & decisions. Get a handle on your data and let us put our deep industry knowledge to work for you. No matter how big or small your organization is, and what data sources you use (spreadsheets, .csv files, databases etc.), you can count on our amazing team of data visualization experts to provide you with the help you need quickly.
- Connect to your data
- Dive deep into your data and uncover powerful insights – visualize them to gain a better understanding of your findings!
- Selecting the right visualization is key to effectively representing your data and realizing its potential. You’ll be able to discover meaningful trends and relationships that can transform your insights into actionable items.
- Develop insights
- Share and act on results
Design In Such A Way User Should Be Engaged
Developing a user-friendly dashboard is among the most integral Data Visualization Strategies. Consistency in data compilation and visualization is key for clear, effective communication of information. Well-crafted visualizations can direct the observer to their conclusions quickly, plus they look great! Seeing a hierarchical view of data can make decision-making much easier and faster. The designer can arrange the data from highest to lowest to ensure that the most critical point stands out and is easily visible to the viewer. The way data is arranged, the colors and fonts applied, and other elements in charts can all play a role in how effectively viewers interpret the data. By making little changes here and there, we can greatly improve how information is gathered and interpreted.
Try To Make Data Visualization Inclusive
The use of different colors to represent data helps people better understand dashboards. According to recent reviews, this is a critical factor in observer decision-making. People responded faster to different color combinations than to similar colors used in charts. For viewers, especially those with vision problems, using similar colors without strong contrast can be a nightmare. To make sure their experience is satisfactory, it is important to use the right color combination and the correct contrast ratio. This will go a long way in creating an amazing experience. Get creative when conveying information – use text & icons to craft unique labels and elements. This will make your communications stand out and be more impactful.
Examine Business Insights
In this hectic world, it’s difficult to find data alignment. One of the most essential best practices is to emphasize the search for correlations among business insights – this can be incredibly beneficial! Taking the time to evaluate your insights is a must for any business striving to accomplish their objectives. Plus, it helps you stay up-to-date with trends and ensures you always deliver top-notch products & services. Furthermore, this analysis can help identify potential issues before they arise. By staying ahead of trends, you can maximize your profits and continue to grow your business.
How Chapter247 Can Help You Provide The Best Staff Augmentation Resources For Data Visualization
Data visualization is a great way to make sense of large amounts of data. To get the most out of it, you should equip yourself with the best visual tools available, like Power BI and Tableau. Be sure to choose the tool that best suits your needs. This tool should offer the highest level of interactivity, appear appealing & attractive, and draw on several data sources.
By creating an orderly and uncomplicated dashboard, viewers can comprehend the information more easily and make better decisions. Sharing these dashboards with other people is also made possible. In case the above seems a lot to be done, simply Click here and connect with us for more information. We shall provide the best staff augmentation resources and weave magic with your complex data. Hurry! Get in touch with us.