
The All-in-One Intelligence Platform for Smarter Section 8 Investments

Client Introduction

A Section 8 Real Estate Investment Intelligence Platform built for investors who need to discover, analyze, compare, and manage affordable housing investment opportunities without switching between a dozen disconnected tools.

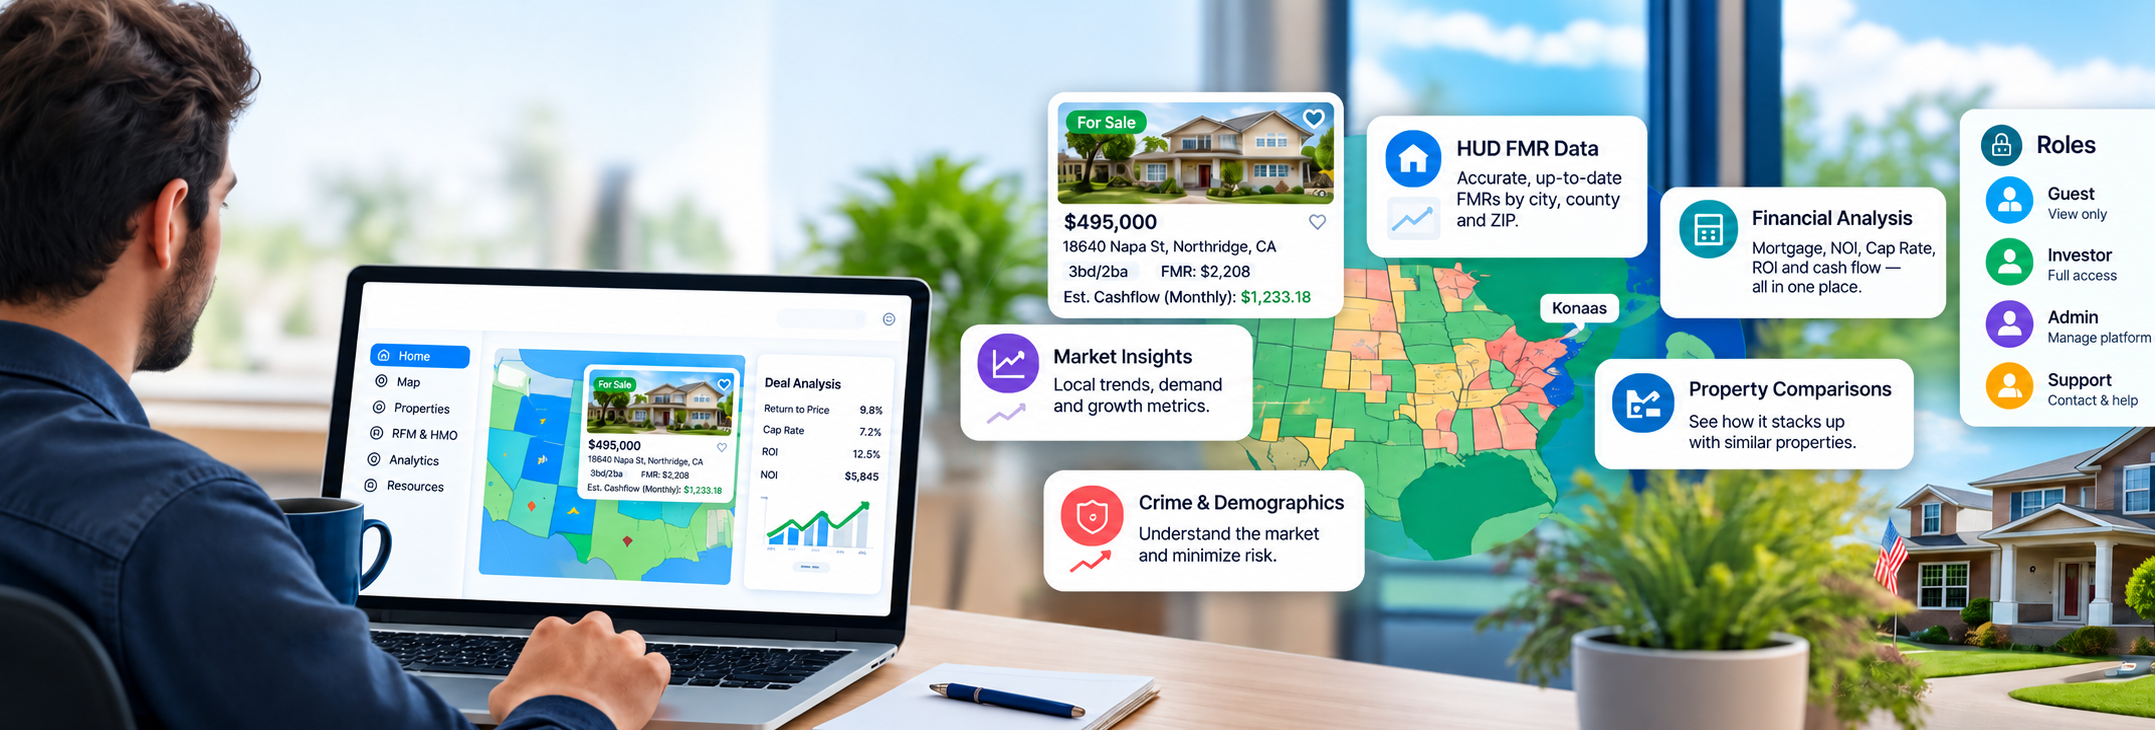
The platform brings together property listings, HUD Fair Market Rent (FMR) data, market intelligence, financial analysis, demographic insights, crime analytics, and AI-assisted guidance into a single research ecosystem — supported by interactive investment maps, advanced deal analysis, and property pipeline management, so investors can move from research to acquisition decisions faster.

The Requirement

  • The client needed a single platform that could replace the fragmented, multi-tool workflow investors typically rely on for Section 8 property research.
  • Centralize property listings, HUD FMR data, rental comparisons, crime, demographics, taxes, and market KPIs into one platform instead of spreadsheets and separate data sources.
  • Give investors a fast way to discover high-potential Section 8 properties through search, filtering, and location-based tools.
  • Provide full financial due diligence on each deal — mortgage, NOI, Cap Rate, ROI, and cash flow — without manual calculation.
  • Support market research at multiple geographic levels (state, metro, county, city, ZIP) using an interactive, KPI-driven map.
  • Build in AI-assisted guidance and direct investor support so users aren’t left to interpret data alone.
  • Support a structured, role-based platform (Guest, End User, Admin, Super Admin) so the business could control access, onboarding, and demo scenarios as it scaled.
Business Challenges

  • User Engagement: Low engagement could lead to incomplete preparation, decreased confidence, and higher dropout rates from courses or tutoring.
  • Content Accuracy: Outdated or misaligned study materials could mislead students, causing confusion and lower exam performance.
  • Performance Tracking: Insufficient insight into strengths and weaknesses could prevent focused improvement and hinder exam readiness.
  • Exam Simulation Fidelity: A poorly simulated NBCOT exam experience could increase anxiety and leave students unprepared for the real test.
  • Real-Time Exam Experience: Without a real-time exam simulation, students could lose out on the time-management practice needed for actual testing conditions.
  • Scalability of Tutoring: High demand for group or private sessions could affect session quality, availability, and student satisfaction.
  • Resource Accessibility: Difficulty accessing PDFs, quizzes, or tools across devices could disrupt study routines and limit learning continuity.
  • Student Confidence Building: Without strategies to manage test anxiety, students could underperform despite having adequate knowledge.
  • Retention of Knowledge: Ineffective reinforcement of concepts could reduce recall during the actual exam.
  • Platform Usability: A complex or unintuitive interface could frustrate students, reduce study efficiency, and hurt engagement.
Chapter 247 Process

We started by understanding the project requirements, objectives, and overall scope. Based on these requirements, we created a structured approach to ensure that each stage of the project was handled with clarity and purpose. It was important to understand the different components of the project and the connections between them. We identified the key dependencies and planned the work accordingly so that each component could be handled in the right sequence. The project was carried out through a structured and phased approach, with each phase focused on specific requirements and deliverables. Regular communication and updates were maintained throughout the project, allowing feedback and changes to be incorporated into the process while keeping the project aligned with the overall requirements.

Delivered Solution – System Architecture

  • The team built  a data-engineering-first platform, where the investor-facing experience sits on top of a heavily automated data pipeline.
  • Multi-source ETL pipelines collect property, HUD FMR, Census, crime, demographic, and market data from APIs, CSVs, and scrapers.
  • The data is cleaned, normalized, deduplicated, and connected through ZIP/city/county/state/FIPS mappings before loading into PostgreSQL.
  • Incremental, scheduled data refreshes update property and market data without reprocessing full datasets.
  • Daily and monthly jobs keep information current while controlling processing cost.
  • A geo-mapping and standardization layer resolves inconsistent schemas, missing values, and duplicate listings.
  • Location-based analytics stay reliable across the platform.
  • An analytics-ready PostgreSQL architecture separates raw ingestion, cleaned/processed data, KPI tables, geo-mapping tables, and application tables.
  • Materialized views and caching keep large analytical workloads responsive.
  • Azure-based infrastructure uses separate staging and production environments.
  • It includes premium storage, scheduled backups, and network-level access controls.
  • Network-level access controls include NSGs, restricted SSH, and IP restrictions.
technologies & RESOURCES


  •  

Duration

ongoing

Resources

10 Tech Experts

Key features

Super Admin

  • Role-based access architecture across Guest, End User, Admin, and Super Admin, each with differentiated permissions and platform visibility.
  • Granular permission management letting Super Admins define exactly which modules, user groups, actions, and Property Analysis Board capabilities individual Admins can access.
  • User and access management — creating accounts, setting access duration, assigning roles, sending credentials, and reviewing login history.
  • Activity logging and platform auditability for administrative actions and permission-driven operations.
  • Handpicked Properties management — curating and highlighting selected investment opportunities for end users.
  • FAQ, contacts, and investor-resource content management, including bilingual (English/Spanish) content across FAQs, categories, and KPI descriptions.
  • KPI content management — naming, describing, and attaching explanatory video content to the KPIs shown on the Interactive Housing Map.
  • Ninja Mode — a privacy-safe demo feature that masks sensitive property address data during presentations and internal reviews.

Key features

End User

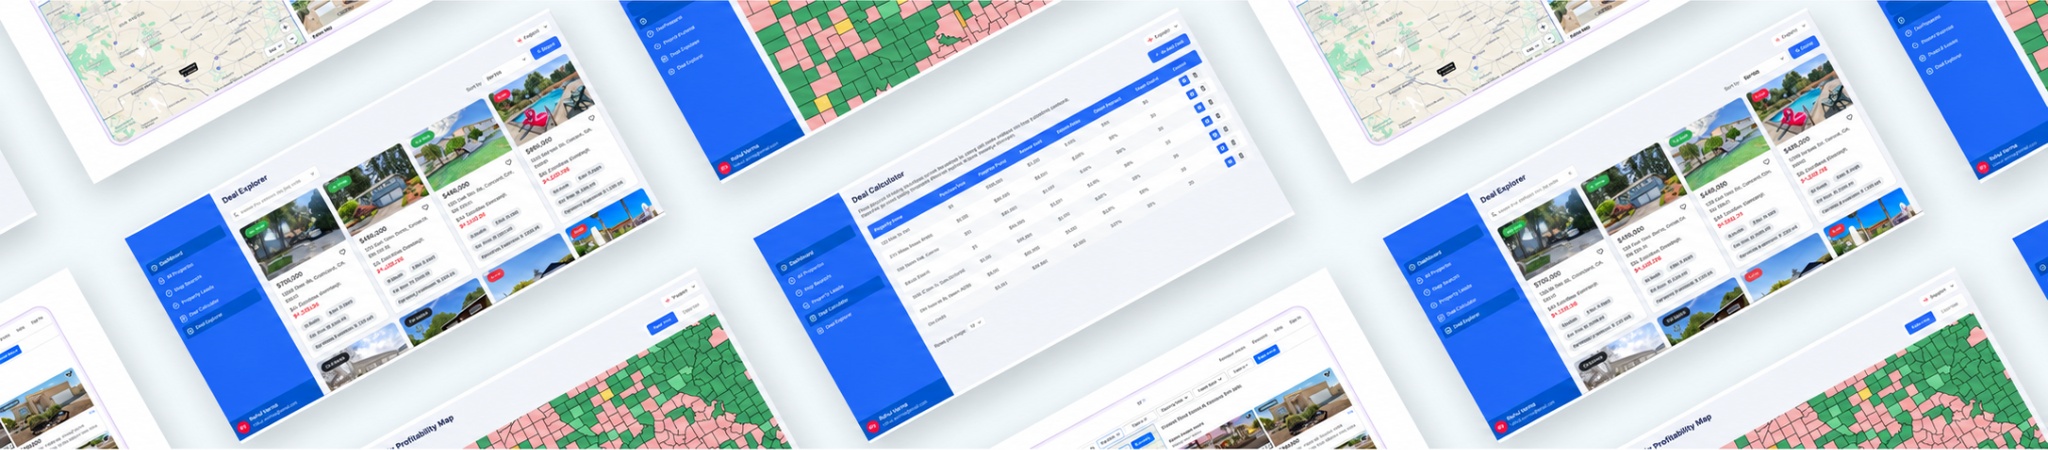
  • Deal Explorer with advanced search, filters, sorting, and side-by-side property comparison.
  • Dual-view property discovery — interactive housing map and list view.
  • Advanced property detail view combining FMR, taxes, crime, demographics, market value, sale history, and nearby schools in one workspace.
  • Dynamic Deal Calculator for ROI, NOI, Cap Rate, cash flow, and mortgage analysis.
  • HUD FMR Intelligence — bedroom-level rent comparison, FMR-to-price evaluation, and Section 8 rental viability scoring.
  • FMR Explorer for county-level profitability research (FMR, median prices, population, active listings, mortgage estimates).
  • City & market research tools combining population growth, crime, rent values, and demographics at the city/county/metro/ZIP level.
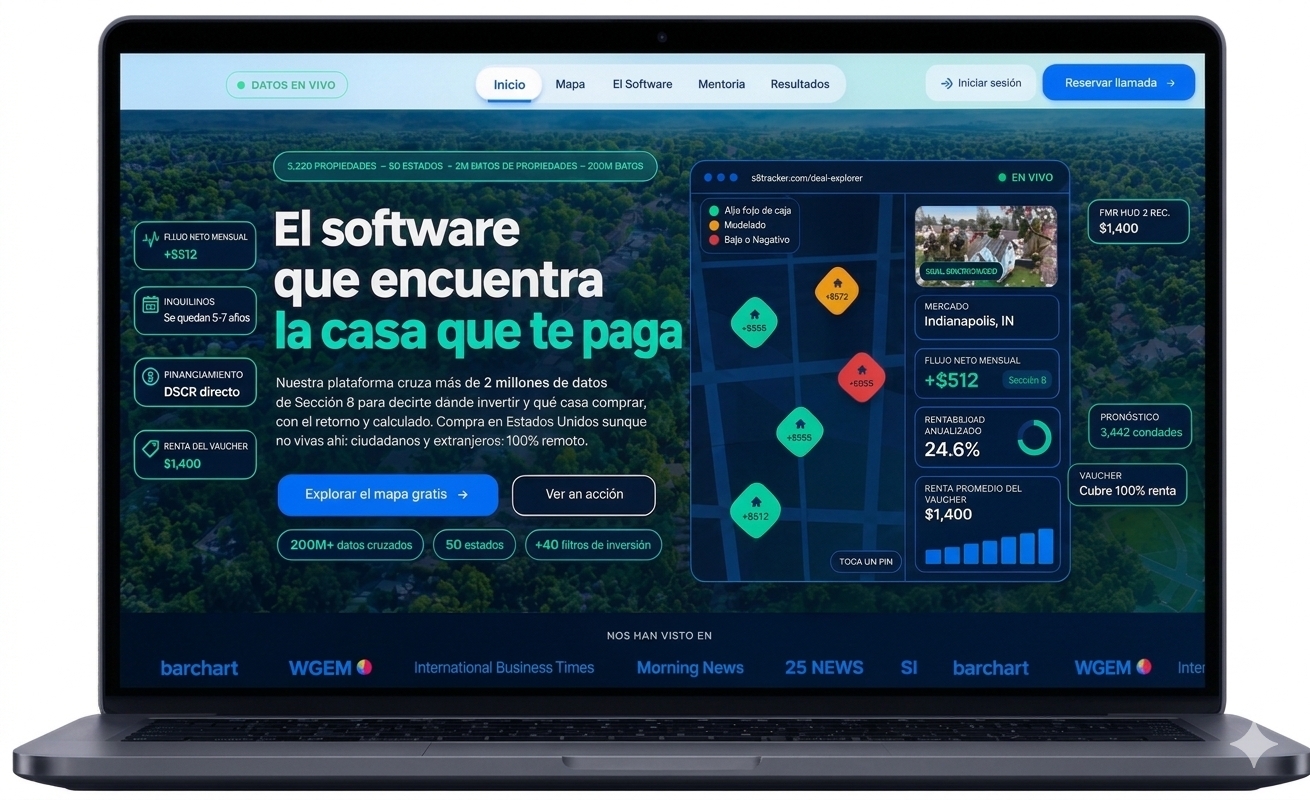
  • Interactive Housing Map with heatmaps, polygons, and 50+ KPI-based market indicators, including historical trends and forecast-style analytics.
  • Deep linking — filters, geography, and KPI selections persist in the URL for shareable/repeatable research.
  • Favorites & Analysis workspace with folders, manual property entry, and saved investment assumptions.
  • Property Analysis Board — a CRM-style pipeline (Analyzed/Approved → Offer Sent → Inspected → Pre-Closing → Closed/Dead Deals) for tracking acquisitions.
  • AI chatbot for real estate Q&A, Section 8 concepts, and platform guidance, plus direct human chat support with attachments and audio messages.
  • Realtor Agent directory — searchable by language, location, experience, and ratings.
  • Deal Matchmaking — community-driven, moderated posting of investment opportunities.
  • Guest preview mode allowing prospective users to explore core modules with advanced analytics gated behind upgrade prompts.
Business Impact

Chapter247 was responsible for the entire front- and backend development which proved instrumental in the project’s overall success.

  • User engagement and interaction has qualititatively increased.
  • Better customer interaction with augmented revenue generation and business performance.
  • Lesser customer complaints with the round the clock live chat availability
  • A marked increase in customer base.
  • The human take-over activation has enabled the users to focus on the intent and the sentiments of the customer.
  • A more-focused marketing approach leading to successful customer acquisition and a considerable cut-down on costs.
  • Reported increase in the rate of Customer Retention

User Interface & User Experience

Let’s Talk About Your Idea

Share your business idea and we ensure you would embrace associating with
us.

Clients Speak

Loading reviews...


Chapter247
Privacy Overview

This website uses cookies so that we can provide you with the best user experience possible. Cookie information is stored in your browser and performs functions such as recognising you when you return to our website and helping our team to understand which sections of the website you find most interesting and useful.